Aggregated Timeline Report
Aggregated Timeline Report provides an overall view of combined records in every project in Excel format.
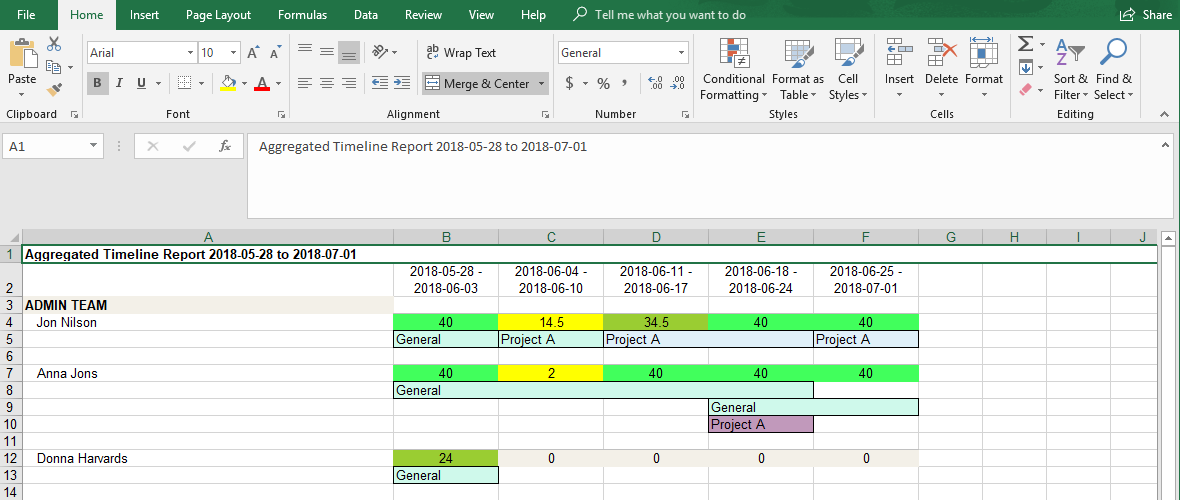
If there are two tasks, bookings, placeholders etc. from the same project scheduled to the cell (same day, week, month based on Units) then ticket is shown as a single item.
If items from the same project are scheduled to the same unit cell but have different color then they are displaying as separate items.
To generate Aggregated Timeline Report follow the steps:
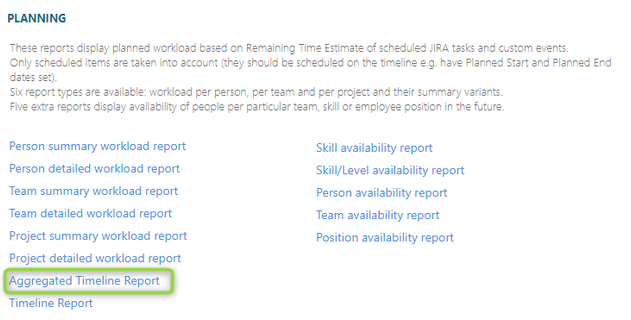
- Navigate to Reports page by clicking User icon on the toolbar > Reports and find the desired report in the list:
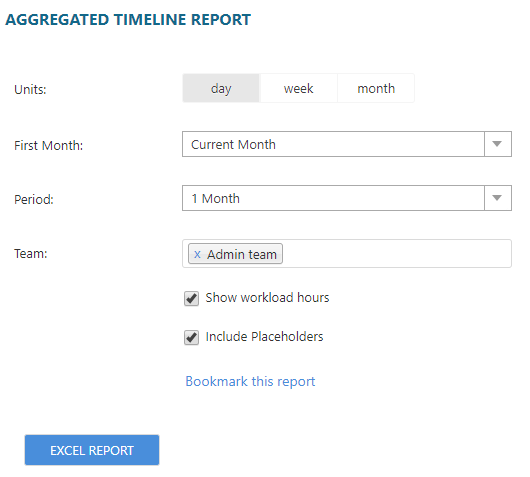
2. Select the display units the data to be grouped by – day, week or month.
3. Select the First Month which the report is supposed to be started from
- the default value is Current Month, other available options are: Previous Month, Current Month and Next Month up to one year.
4. Select a Period the report is to be generated for.
- the default value is 1 month, options are from 1 month to 12 months.
5. Select a Team/Teams the report is to be generated for.
- the default value is Current selected Team on Dashboard.
6. Check 'Show workload hours' option
7. Check 'Include Placeholders' option
8. Generate Excel report:
Timeline Report opens in Excel format: